
Atterberg Limits and Plasticity Index: What the Numbers Mean for a Foundation
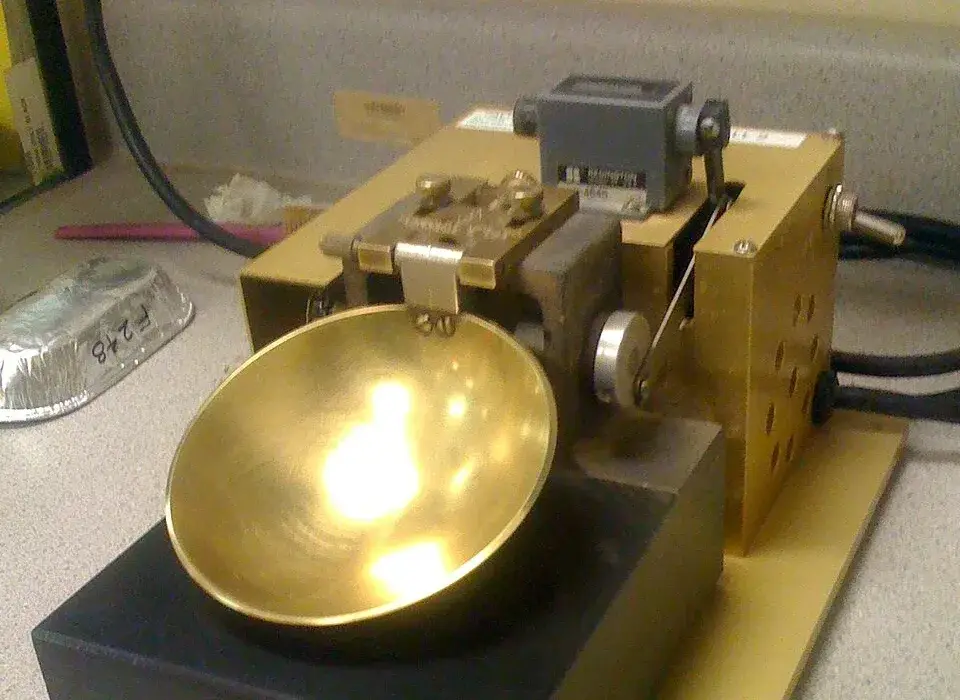
A liquid limit device (Casagrande cup). The lab cuts a groove in a soil pat in the cup and counts the drops it takes for the groove to close; the moisture content at 25 drops is the liquid limit. (Photo: E smith2000 / Wikimedia Commons (public domain; cropped) · Public domain)

Atterberg limits are lab tests that find the moisture contents at which a clay or silt changes behavior: from crumbly to moldable (the plastic limit) and from moldable to runny (the liquid limit). The gap between them is the plasticity index, or PI. For anyone building on clay, PI is the number to look for in the soils report, because it's the first screen for whether the ground will shrink and swell. Under the International Building Code, a PI of 15 or more is one of the triggers for treating soil as expansive.
This guide skips most of the lab procedure, which the top search results already cover, and focuses on what the numbers mean for your project.
What are Atterberg limits?
Fine-grained soil changes state as its water content changes. Dry, it's hard and brittle. Add water and it becomes moldable like modeling clay. Add more and it flows. The Atterberg limits mark those boundaries as moisture contents (percent water by dry weight of soil). The FHWA Soils and Foundations Reference Manual calls them index tests, because they give an indication of a soil's strength, permeability, compressibility and shrink/swell potential without testing each property directly.
In the US, labs run them under ASTM D4318 on the portion of the sample that passes a No. 40 sieve.
| Limit | What it marks | How the lab finds it |
|---|---|---|
| Liquid limit (LL) | Moisture content above which the soil behaves like a viscous liquid | A groove cut in a soil pat in the brass cup closes over ½ inch at 25 drops of the cup |
| Plastic limit (PL) | Moisture content below which the soil stops being moldable | A thread of soil rolled by hand just crumbles at 1/8 inch diameter |
| Shrinkage limit (SL) | Moisture content below which further drying causes no more shrinkage | Measured on a dried pat; reported less often |
| Plasticity index (PI) | The range of moisture over which the soil is plastic | PI = LL − PL |
Plasticity index: why one number does so much work
A sand has no plasticity: there's no moisture range where you can roll it into a thread. A lean clay might be plastic over a modest range. A fat, high-plasticity clay stays moldable over a very wide range of moisture, and that same property means it can take on, and give up, a lot of water. Water going in and out of the clay structure is what drives swelling and shrinking.
That's why PI shows up so often in design:
- Code screening. IBC §1803.5.3 treats soil as expansive when it has a PI of 15 or more, more than 10 percent passing the No. 200 sieve and more than 10 percent of particles finer than 5 micrometers. An expansion index above 20 is an alternative test.
- Engineering guidance. FHWA notes that soils with a PI under 15 generally won't show expansive behavior, and that above 15 the clay content should be evaluated along with the limits. It also says soils classified CL or CH should be considered potentially expansive.
- Clay mineralogy. How much a clay swells depends on its minerals. FHWA describes montmorillonite (smectite) as highly expansive, illite as none to moderate and kaolinite as almost none. PI combined with the clay fraction gives a rough read on which you're dealing with.
How Atterberg limits classify the soil
The limits also set the soil's group in the Unified Soil Classification System (USCS), the two-letter code you see on a boring log. Fine-grained soils are plotted on a plasticity chart of PI against LL:
- A vertical line at LL = 50 splits low-plasticity soils (L) from high-plasticity soils (H).
- The A-line, PI = 0.73 × (LL − 20), separates clays (above the line) from silts and organic soils (below it).
So CL is a lean clay (LL under 50, above the A-line), CH is a fat clay (LL 50 or more, above the A-line), and ML and MH are silts. On a North Texas boring log, CH layers in the upper few feet are the ones the foundation engineer pays the most attention to.
Reading Atterberg limits in a geotechnical report
Here is an illustrative line of the kind you'll find in a lab summary table. The numbers are an example, not from a real project.
| Boring | Depth (ft) | Moisture (%) | LL | PL | PI | Passing No. 200 (%) | USCS |
|---|---|---|---|---|---|---|---|
| B-2 | 2–4 | 24 | 62 | 21 | 41 | 91 | CH |
What it tells you:
- PI = 62 − 21 = 41. Well above the IBC threshold of 15, and with 91 percent fines this sample would meet the IBC expansive soil screen on PI and fines (the clay-size test or an expansion index would complete it).
- LL of 62 with PI of 41 plots above the A-line and right of LL 50, so the USCS group is CH, a high-plasticity clay.
- Liquidity index compares the natural moisture to the limits: LI = (w − PL) / PI = (24 − 21) / 41 ≈ 0.07. FHWA describes soil near its plastic limit as stiff and soil near its liquid limit as soft and compressible. An LI this close to zero means the clay is on the dry side of its plastic range. Dry, high-PI clay has room to take on water, so it has room to swell if the site gets wetter after construction.
- Depth matters. FHWA notes that expansive volume changes most commonly occur in the upper 3 to 10 feet of a soil deposit, the "active zone" where moisture changes with the seasons. High PI at 2 to 4 feet matters more for a slab than the same PI at 30 feet.
The limits are a screen, not a final answer. For a project on clay, expect the geotechnical engineer to add swell tests (ASTM D4546), moisture profiles with depth and, for post-tensioned slabs, the specific design parameters the slab method needs.
How the numbers change the foundation
Atterberg limits feed several decisions on a typical commercial project:
| Decision | How PI and the limits come into it |
|---|---|
| Is the soil expansive under the code? | IBC §1803.5.3 screen (PI of 15 or more, plus fines and clay content or an expansion index) |
| Foundation type | High-PI clay in the active zone pushes designs toward stiffened slabs, drilled piers below the active zone, or removing and replacing the clay (IBC §1808.6) |
| Slab-on-ground design | Swell estimates and slab design parameters start from index tests and are refined by swell and suction testing. See our article on post-tension slabs on expansive soil |
| Building pad preparation | Thickness of select fill, moisture conditioning or chemical treatment of the subgrade |
| Retaining wall backfill | High-plasticity CH clay is listed as unsuitable backfill in IBC Table 1610.1 |
| Pavement subgrade | Plastic clays lose strength when wet and often need treatment under paving |
For the bigger picture of how the geotechnical results turn into a foundation, see our guide to foundation design. Where the clay is so active that the floor is suspended above it, the plumbing needs special attention, which we cover in suspended foundations and plumbing.
Common mistakes when reading the limits
- Looking at one sample. PI varies from boring to boring and layer to layer. Look at the range across the building footprint and the upper 10 feet or so.
- Ignoring natural moisture. The same PI means more future swell when the clay is dry at the time of drilling, as in a late-summer investigation, than when it's already wet.
- Treating "non-plastic" fill as safe everywhere. A non-plastic result on imported fill is good news, but check that the fill is actually what gets placed.
- Using a lawn or garden soil test. Agricultural soil tests measure nutrients and pH. They say nothing about plasticity or swell.
Working with Isbell Engineering Consultants
Isbell Engineering Consultants is a structural, geotechnical and civil engineering firm based in Valley View, Texas. Its geotechnical engineering services include site investigations with soil sampling and testing, soil and rock mechanics analysis, foundation recommendations and ground improvement such as chemical soil stabilization. If you're planning a commercial, industrial or municipal project on clay and want the lab data turned into clear foundation and pad recommendations, send the site details through the contact page.
Frequently asked questions
What do Atterberg limits tell us?
They show the moisture contents at which a fine-grained soil changes from solid to plastic to liquid. From them you get the plasticity index, which indicates how much the soil can shrink and swell, and the soil's USCS classification (for example CL or CH), which engineers use to anticipate strength, compressibility and swell.
How do you calculate the plasticity index?
Subtract the plastic limit from the liquid limit: PI = LL − PL. A soil with a liquid limit of 45 and a plastic limit of 20 has a PI of 25.
What is a high plasticity index?
There's no single cutoff for "high," but two benchmarks matter for foundations. The IBC uses a PI of 15 or more as one of its expansive soil criteria, and FHWA notes that soils below 15 generally don't behave expansively. A clay with an LL of 50 or more that plots above the A-line is classed as high-plasticity (CH).
What is the liquid limit of soil?
It's the moisture content at which a soil changes from plastic to liquid behavior. In the standard test, it's the moisture content at which a groove in a soil pat closes over ½ inch after 25 drops of the liquid limit cup.
What is the difference between the liquid limit and the plastic limit?
The liquid limit is the wet boundary, where the soil starts to flow. The plastic limit is the dry boundary, where it stops being moldable and starts to crumble. The difference between them is the plasticity index.
Sources
- FHWA NHI-06-088, Soils and Foundations Reference Manual, Volume I (§5.3.5 Atterberg Limits, §5.7.1 Swell Potential of Clays, Table 2-4)
- ASTM D4318, Standard Test Methods for Liquid Limit, Plastic Limit, and Plasticity Index of Soils
- 2021 IBC §1803.5.3 Expansive Soil (Texas, via UpCodes)
- US Army FM 5-472, Appendix B: Unified Soil Classification System
- IBC §1610.1 Lateral Pressures and Table 1610.1 (via UpCodes)
- Wikipedia, Atterberg limits
Image credits
- Brass cup of a mechanical liquid limit device on a soils lab bench, next to a moisture-content tin. Photo: E smith2000 / Wikimedia Commons (public domain; cropped) · Public domain
Related articles
Copyright © 2026 Isbell Engineering Consultants - All Rights Reserved.
Made & Managed by North Texas Business Solutions